Wildfire Air Quality Surveillance
What is the current wildfire-related air quality in your community and what should you do?
This page is updated every Tuesday and Friday between June and October, or more frequently if the local air quality situation changes. Last updated September 26, 2025.
For more information on what is in wildfire smoke, the health risks, and how to protect yourself, click here: Wildfires and Your Health
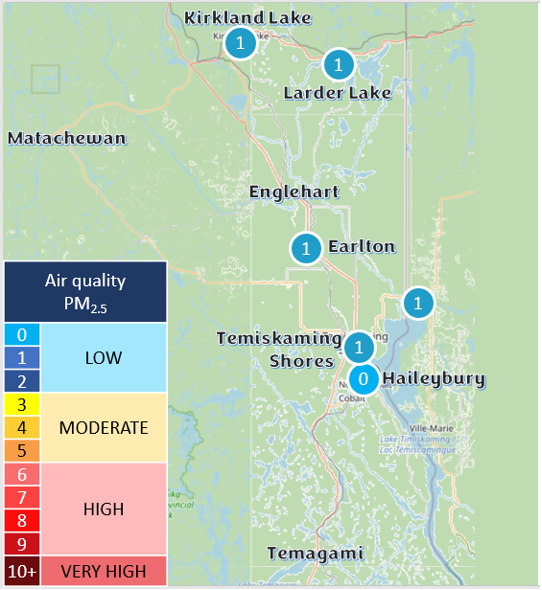
Health Risk3
Air Quality Level PM2.5
|
At-Risk Population
Some people are more likely to get sick.
Find out if you are one of them
|
General Population |
| LOW |
Enjoy your usual outdoor activities. |
Ideal air quality for outdoor activities. |
| MODERATE |
Consider reducing or rescheduling strenuous activities outdoors if you are experiencing symptoms. |
No need to modify activities unless symptoms occur (e.g., coughing, throat irritation). |
| HIGH |
Reduce or reschedule strenuous activities. Children and the elderly should also take it easy. |
Consider reducing activities if symptoms such as coughing occur. |
| VERY HIGH |
Avoid strenuous outdoor activities. Children and elderly should also avoid exertion. |
Reduce or reschedule strenuous activities, especially if symptoms occur. |
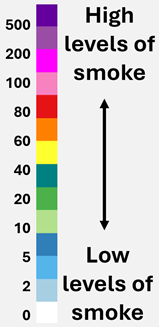
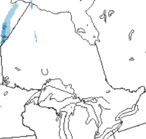
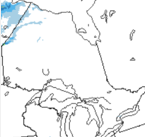
SMOKE FORECAST4
|
Sep 26
Low levels of smoke are expected in Northeastern Ontario.
|
Sep 27
Low levels of smoke are expected in Northeastern Ontario.
|
Sep 28
No smoke is expected for Northeastern Ontario. 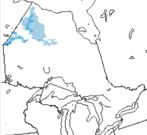
|
Methods and Sources
1 The health risk level represents a
summarized value from purple air monitors which measure Particulate Matter. The
recommendations are from the Air Quality Health Index (AQHI) scale, which uses
a combination of particulate matter (PM2.5), ozone and nitrogen
dioxide, however, only data on particulate matter is available for our health
unit area. For more details on real-time weather alerts, visit Environment Canada.
These monitors were provided by Environment and Climate Change Canada
and are generously hosted and maintained by various community partners.
2 Source: Environment and Climate Change
Canada - Meteorological Services of Canada in collaboration with the
University of Northern British Columbia. Mapping tool. https://cyclone.unbc.ca/aqmap
3 Government of Ontario. Wildfire Smoke
and Air Quality Reference Document, 2024. Version 1.0 (05/2024). ISBN
978-1-4868-8087-4
4 Government of Canada. 72h Hourly Maps
at Ground Level - 12 UTC https://weather.gc.ca/firework/firework_anim_e.html?type=em&utc=12
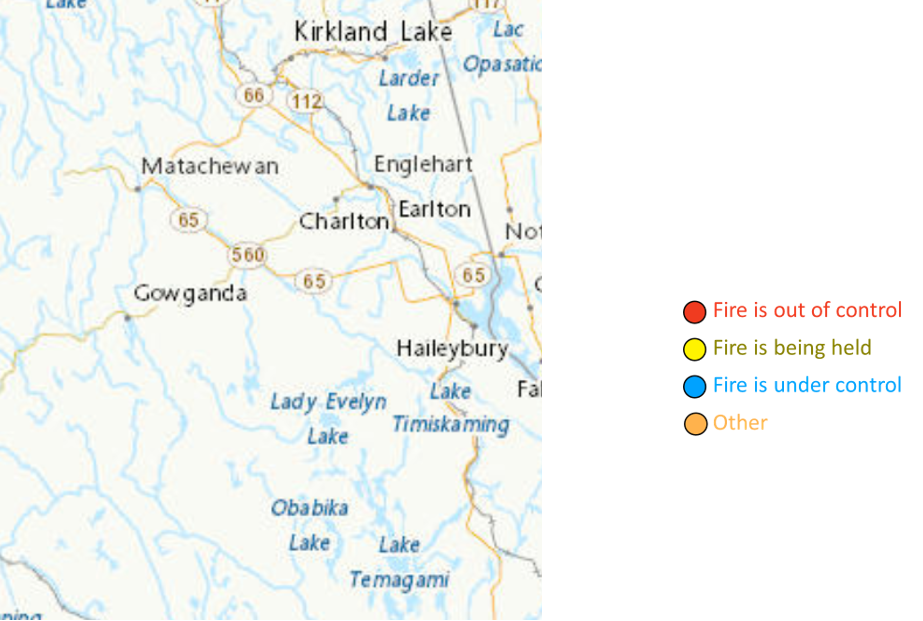
5 Government of Canda. Natural Resources
Canada. Interactive Map. Canadian
Wildland Fire Information System | Interactive map
20250926/mm:tr